
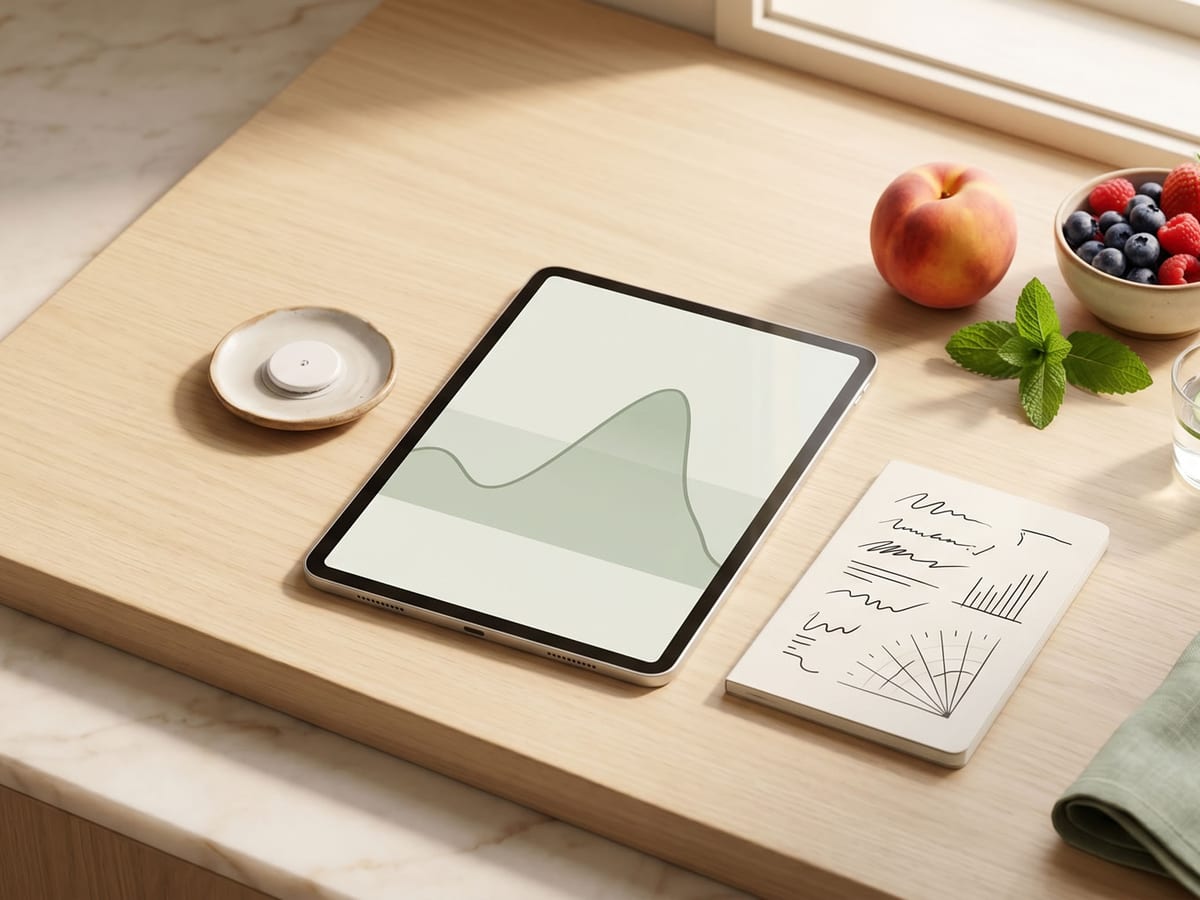
Continuous glucose monitors quietly became one of the most useful diagnostic tools in functional nutrition practice over the last five years — and a lot of clinicians still treat them as a diabetes-only technology. That framing is twenty years out of date. CGMs in a non-diabetic patient surface patterns that no blood draw, no food diary, no DNA panel can match: how this specific person’s glucose responds to this specific meal, at this specific time of day, under this specific stress and sleep load. Used well, two weeks of CGM data can do more to clarify a personalised plan than two months of trial-and-error.
Why CGM data is different from anything else you order
A fasting glucose reading captures one moment. An HbA1c averages three months but smooths over the spikes that actually matter. A CGM samples every 1–5 minutes for 14 days straight — producing roughly 3,000–14,000 data points per patient. The result is a behavioural map of metabolism, not a snapshot. You see the breakfast that crashes them at 11am, the post-lunch slump that drives their afternoon cravings, the late dinner that disrupts their morning fasting glucose, the stressful meeting that produces a glucose spike with no food at all.
This level of granularity changes the conversation with patients. “Eat more whole grains” becomes “this oatmeal spikes you to 180 mg/dL; this paneer-and-veg omelette holds you flat. We are going to try the second pattern for two weeks.” The patient sees their own data and self-corrects long before the practitioner has to push.
What to actually track during a two-week wear
Drowning the patient in numbers is the most common mistake. A small set of metrics drives most of the clinical insight.
Time in range (TIR)
Percentage of the wear period spent between 70–140 mg/dL. For a metabolically healthy non-diabetic, target is >90% TIR. Below 80% suggests meaningful glucose dysregulation worth addressing even with a “normal” HbA1c.
Mean amplitude of glycaemic excursions (MAGE)
Average size of the swings. Big swings — even within “normal” range — correlate with oxidative stress, inflammation, and metabolic dysfunction. A patient ping-ponging between 60 and 180 all day is in worse metabolic shape than one holding 95–115 with the occasional 140 peak.
Post-prandial peak and recovery time
How high does each meal push glucose, and how long until it returns to baseline? Peaks above 140 mg/dL or recovery taking >3 hours suggest insulin resistance or carbohydrate intolerance at that meal composition.
Fasting glucose pattern
Morning fasting glucose between 80–95 mg/dL is the comfortable range. Persistent readings above 100 mg/dL on a CGM (more reliable than single fingersticks) suggest the metabolic picture deserves attention even before HbA1c becomes abnormal.
The “dawn phenomenon” check
A glucose rise between 3–7am driven by cortisol and growth hormone is normal, but a strong dawn rise in a patient with otherwise good control often points to under-eating or stress dysregulation worth addressing.
What CGM data does not tell you
It is worth being honest about the limits. CGMs measure interstitial fluid glucose, not blood glucose — there is a 5–10 minute lag and small accuracy variations that matter at very low or very high values. They do not tell you about insulin levels, which is the actual driver behind much of what the glucose curve shows. They do not measure lipids, inflammation, hormones, or anything else.
The biggest pitfall: patients who become anxious about every peak and stop eating foods they actually tolerate. A small post-meal rise is normal. A 180 mg/dL spike with a slow recovery is the signal worth acting on. Briefing the patient on what to ignore is as important as briefing them on what to watch.
The clinical workflow that produces durable change
Three steps consistently turn a CGM trial into a lasting plan.
One: baseline wear with no instructions. The first week, the patient eats their normal diet and lives their normal life. This produces honest data — what does the actual metabolism do, not what does it do when the patient is performing for the practitioner. Skipping this step and going straight to “eat better and see what happens” loses the comparison point that makes the rest of the work meaningful.
Two: targeted intervention based on the data. Identify two or three patterns from the baseline week — usually the worst-spiking meal, an off-pattern sleep night, and an obvious time-of-day vulnerability — and design changes specifically for those. Generic “eat more vegetables” advice wastes the data.
Three: re-wear at 8–12 weeks. A single CGM trial gives a snapshot. A second wear after the intervention shows whether the changes actually moved the metrics. This is also when the patient sees their own progress quantified, which is one of the most powerful adherence drivers we have.
Where CGMs combine with the rest of the workup
CGM data is at its best when paired with the other inputs that shape personalised nutrition. Microbiome composition shapes glucose response — two patients eating the same rice will have different curves based on their bacterial population. Genetic variants like TCF7L2 (covered in our nutrigenomics primer) predict who will spike sharper. Sleep tracking overlays beautifully — a poor sleep night reliably elevates the next day’s curves. Stress markers (HRV or self-report) explain the spikes without food. Used alone, the CGM is interesting. Used in combination, it becomes a diagnostic tool that actually shapes a long-term plan.
For practitioners running CGM trials with patients, the work is in the interpretation, not the device. The hardware is now accessible and affordable; the clinical skill is in turning two weeks of data into changes the patient will actually sustain for two years. At Horta Nutrition, we build CGM-informed nutritional protocols for practitioners in our network — pairing the glucose data with microbiome, genetic, and lifestyle inputs to design plans that hold up after the sensor comes off. If you are considering adding CGM trials to your practice and want a workflow to start from, the practitioner guide walks through how we integrate it into the larger personalised-nutrition picture.